


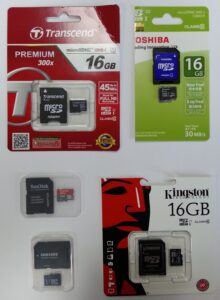
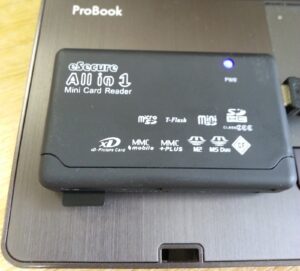
In order to separate the wheat from the chaff, we’ve picked 16GB Class 10 MicroSD cards (with full size adapters) from the top five brands out there: SanDisk, Transcend, Kingston, Toshiba and Samsung. We’re not too concerned with who made ’em; we just want to see which is the best package overall. To that end, we’ve benchmarked the cards in two different environments: firstly using a MicroSD card USB reader on a Windows PC and secondly on an Android mobile device. This gives us a really good idea of how these five cards perform in real-world scenarios.
If you can’t be bothered with all the stats and just want the summary (and we can’t blame you!), click here.
Test rig
Our mobile device test rig consisted of the brilliant Samsung Galaxy Note 2 (replaced by the even more incredible Note 3). Using this phone we ran the handy app A1 SD Bench. It’s less comprehensive than CrystalDiskMark, but gives you a good feel for how the card performs in one of its most likely use cases – plugged into a smartphone or tablet.
The Tests
For our tests, we ran five passes of the benchmarks on each card. When a test run contained anomalous results (which could be down to processor blips or other irrelevant causes), we discarded the test and ran again. We then averaged the scores from the five clean passes. We think this gives us a pretty bulletproof set of scores.
We ran three distinct batteries of tests:
- 5 passes of CrystalDiskMark with the file size set to 1000MB
- 5 passes of CrystalDiskMark with the file size set to 50MB
- 5 passes of A1 SD Bench
The results are summarised in this image (click to enlarge):

This is worthy of some explanation! The bottom row of the table shows the “standard deviation”. You don’t need to understand statistics to get the point: if there’s not a lot of difference between the cards, you’ll see a small figure on this row. So for example in the sequential read tests, there’s very little difference between the cards (standard deviations of 0.12 and 0.18). In the case of a 50MB file written randomly in 512k chunks, there’s a huge variation – 5.97. If you look more closely at the column, you’ll see that the Samsung card clocked in at 15.2MB/s in this test, which is very good, while the Toshiba managed a paltry 1.3MB/s.
The bar chart overlays are fairly easy to follow, we hope. For each column, the card that has the biggest bar achieved the best speeds. This is most noticeable on columns with the largest deviation (512K random writes).
The price column is colour-coded going from red to green; expensive to cheap. “Expensive” is a relative term – there’s only £3.50 difference between the most expensive and least expensive cards here. Mind you, that means that the pricy SanDisk is over 40% more expensive than the modest Toshiba.

With generally narrow deviations, it’s hard to pick out an outstanding card, but if you can managed to stare at the figures a bit without your eyes glazing over, we do think a hero emerges.
Look at that Samsung card. Best at the 1000M sequential read. Best at the 1000MB sequential write. Second best at the 1000MB/512K random write and leading the pack for the 50MB/512K random write. In almost every test, it achieves consistently good results. It’s top dog when it comes to writing data and no slouch at reading it. All this and it’s the second cheapest.
Conclusion

Light sabre duel image copyright © Sean Dreilinger, licensed under Creative Commons. Used with permission.


 A few applications recently started failing to save photos to the iPhone camera roll. A quick dig around via SSH confirmed this; it was not that they were saving but were somehow hidden – they were not there at all.