
As a security professional, unless you work for an MSSP (Managed Security Service Provider), security is simply a cost to the business. Fitting a swipe card door entry system will not in itself generate more revenue. Increased password complexity rules are unlikely to result in increased sales.
How then do we justify our existence? By the way we reduce risk.
If you work in penetration testing or you’re a network security engineer, you might find this to be a very unsexy subject. Risk. Boring. But it underpins everything you do and should be at the heart of every choice you make. We do not secure our networks simply because the manual says we should, or because the compliance department insists on it; we do it because it reduces risk. In reducing risk, we’re improving stability, longevity, our ability to service our customers; in short, we’re protecting our jobs.
Well then. How do you know if your actions as a pen tester or engineer reduce risk? Through risk assessments. Stay with me.
You may already have been subject to a risk assessment in your workplace – checking you know how to use your office chair, for example. And if this is your only experience of risk assessment, I can understand why you might be completely put off by the whole thing.
But there’s more to it than that. And risk assessment in information security can be a lot more interesting (and less patronising). Truly. I’m an engineer by disposition and yet I’m excited about risk.
Now if you’ve been around for any length of time, you’ve no doubt seen one of these, the humble risk matrix:
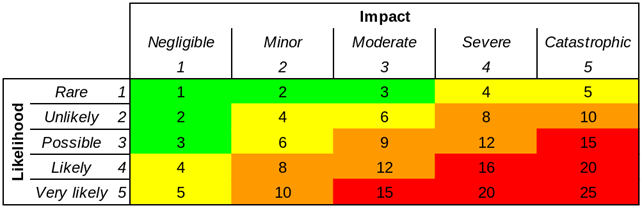
On the face of this, a risk matrix couldn’t be easier to understand. (Perhaps that’s why we like them.) For any given risk, figure out the likelihood of it occurring (on a scale from one to five) and also the consequence, again on a scale of one to five. You can now position this risk on the matrix. And hey, maybe even multiply those two numbers together, to give you a single overall risk figure. Why not. Likelihood 4, consequence 5, okay that’s a risk of 20. Simple.
But what do we mean by ’20’? What do you mean? What does your CEO mean? Is it an absolute number? Or relative? Is a 20 twice as bad as a 10? The fact is that different people can have completely different perspectives on the meaning of these figures. We only have the illusion of communication. We’re using ordinal numbers, not cardinals.
A five by five risk matrix is an example of qualitative (as opposed to quantitative) risk analysis. A relatively arbitrary value is assigned on the basis of a subjective view of a risk.
Some organisations partially overcome the limitations of this approach by assigning explicit values to different ranks in the risk matrix. The likelihood can be split into five bands of 20% each, for example. Financial values are applied to impact. This is semi-quantitative analysis. E.g.:
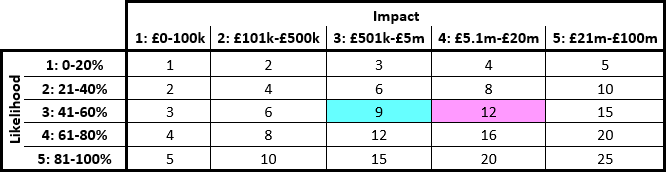
Such divisions can also be misleading, unfortunately. Consider:
- A 41% likelihood (3) of a £5.1m impact (4) would be scored as 12.
- A 60% likelihood (3) of a £5m impact (3) would be scored as 9.
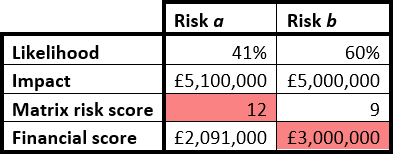
In this risk matrix analysis, risk a seems to be more severe than risk b. But consider the probability calculations:
- A 41% likelihood of a £5.1m impact gives financial exposure of £2,091,000.
- A 60% likelihood of a £5m impact gives financial exposure of £3,000,000.
So the risk matrix shows a to be the higher risk, but the calculation shows b to be higher. Both can’t be correct. Using a probability scale combined with likelihood range slices demonstrably results in incorrect prioritisation. (And a lack of these clarifying measures must inevitably result in even less reliable ‘calculations’.)
This may seem like a trivial example, but this could be the difference between a project being approved or postponed – on the basis of faulty analysis. And if that project is life-or-death – which it might be, in military or healthcare applications – then the risk matrix could indeed kill you*.
I’ll leave it on that bombshell – in later posts I will discuss some alternatives.
*(You got me, I’m exaggerating for effect.)

I think there are two major flaws with your argument:
1. The problem with your matrices is not with the idea of matrices but your attempt to include meaningless numbers. I use matrices and the risks are against risk appetite rather than some arbitrary set of numbers: green is within appetite, amber is heading towards being outside of appetite, red is out of appetite.
2. Your solution is to define a quantiative approach. Theoretically marvellous of course, but practically impossible. We lack the equivalent of insurance actuarial tables going back decades on which to base our calculations, especially of probability. And even if they did they would be out of date.
I use, and like, matrices because they give me a consistent -possibly consistently flawed- and documented basis for my assessments beyond “it feels kind of reddish” and this allows for discussion.
Hi Edward. Thanks for your comments – I get where you’re coming from and I completely agree that establishing a risk appetite is an important part of the picture. Presumably your defined risk appetite uses numbers or a scale of some sort? Without measurement, it’s not possible to compare the extent of a risk with the business’s appetite for risk (other than in very generic, non-specific terms). Whether you use ordinal numbers, cardinal numbers or colours, there needs to be a method for comparing the risk with the appetite. The point is: how do you know whether a risk is red, amber or green?
As to your point about the impossibility of quantitative analysis, I’d simply invite you to read my next article. I hope you’ll see that it can be done, with little effort, and without actuarial tables (which I agree would be overkill). In fact that’s the main premise of the book I reference, How to Measure Anything in Cybersecurity Risk. The authors have consistently found that security practitioners, introduced to simple quantitative methods, concede that (a) these methods are not difficult or impossible as supposed and (b) they are significantly, demonstrably superior to qualitative methods.
It’s up to you of course. I’d just suggest trying the approach I’m advocating. It won’t take long. And if you ultimately prefer matrices and RAG statuses and find them to be the best tool for your business, then absolutely you should continue to use them. Just give the quantitative methods a chance?